Figure 5.
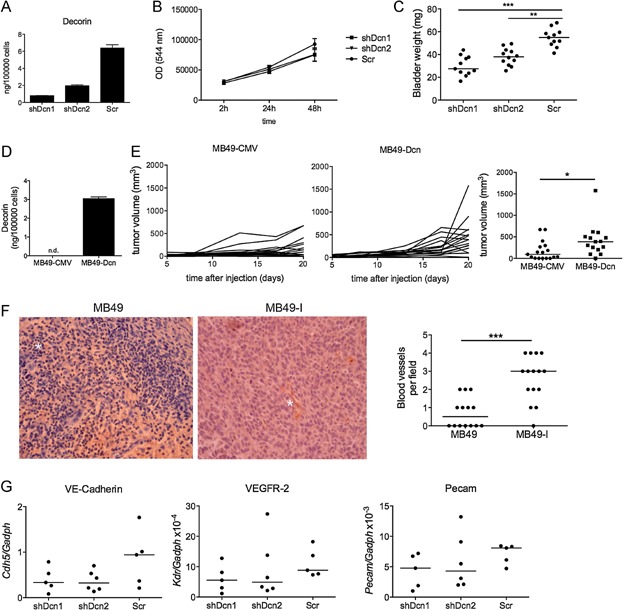
Decorin is necessary and sufficient for increased invasiveness of MB49-I cells
Secretion levels of decorin quantified by ELISA in the 24 h-conditioned medium of MB49-I cells infected with lentiviruses expressing 2 different shRNA to decorin (shDcn1 and shDcn2) or a control shRNA (Scr). Representative results from 2 independent experiments are shown.
In vitro growth of MB49-I cells transduced with shDcn1, shDcn2 or Scr quantified during 48 h using Cell Titer blue viability assay. (pool of 2 independent experiments).
In vivo growth of MB49-I cells transduced with shDcn1, shDcn2 or Scr in C57Bl/6J female hosts. Mice were sacrificed 7 days after orthotopic injection and weight of individual bladders is shown (pool of 2 independent experiments). Horizontal bar = median. **: p = 0.0010; ***: p < 0.0001 (Mann–Whitney test).
Secretion level of decorin quantified by ELISA in the 24 h-conditioned medium of MB49 cells transfected with a decorin-expressing (MB49-Dcn), or a control plasmid (MB49-CMV). Bars represent mean ± SEM of duplicate wells from one representative experiment out of two. (n.d.: not detected).
In vivo growth of MB49-Dcn and MB49-CMV after subcutaneous injection in male mice. Growth in individual mice (middle and left panels) and tumour volume at day 20 (right panel) are shown (pool of 2 independent experiments). Horizontal bar = median. *: p = 0.0206 (Mann–Whitney test).
Blood vessels quantified by anti-CD31/Pecam1 immunohistochemistry in orthotopic MB49 and MB49-I tumours. Representative photographs (left panels, ×40) and quantification in 2–3 fields of 5–7 individual tumours (right panel) are shown. Stars indicate one blood vessel. ***: p < 0.0001 (Mann–Whitney test).
Expression of VE-Cadherin (Cdh5), VEGFR-2 (Kdr) and Pecam1 in MB49-I-shDcn1, MB49-I-shDcn2 or MB49-I-Scr tumours were analysed by quantitative RT-PCR 20 days after tumour injection. A.U. of gene expression for 5–6 individual mice per group are shown.