Figure 5.
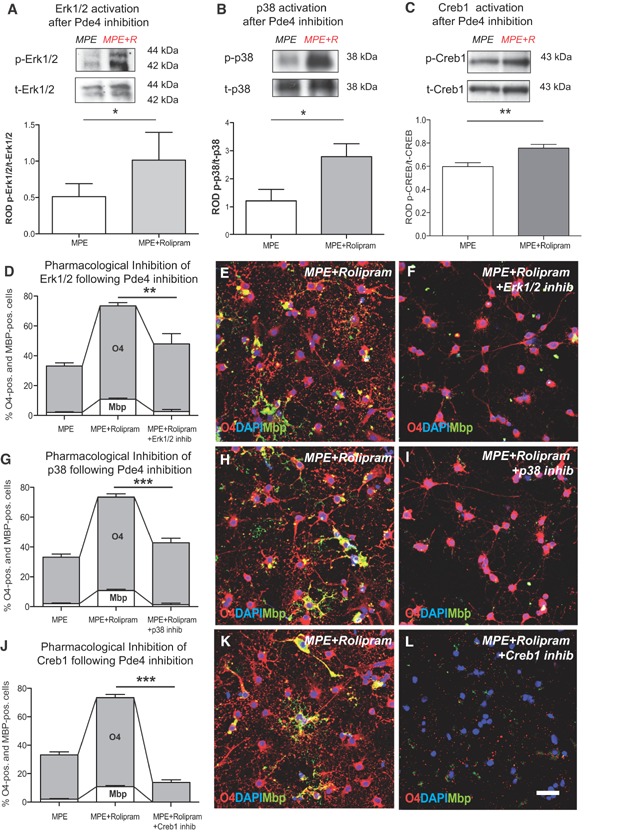
Promoting OPC differentiation by inhibition of Pde4 depends on Erk1/2, p38Mapk and Creb1 activity.
A–C. Assessment of Erk1/2, p38Mapk and Creb1 phosphorylation by immunoprecipitation in response to rolipram treatment. Top, representative blots; bottom, quantification based on ROD. (A) Erk1/2: n = 3; t-test: *p < 0.05; MPE: 0.3406 ± 0.01203, MPE + rolipram (MPE + R): 0.8816 ± 0.04381; (B) p38Mapk: n = 3; t-test: *p < 0.05; MPE:1.217 ± 0.4094, MPE + rolipram: 2.788 ± 0.4606; (C) Creb1: n = 5; t-test: **p < 0.001; MPE: 0.5972 ± 0.03408; MPE + R: 0.7560 ± 0.03277.
D. Bar graph showing the percentage of O4/Mbp-positive cells cultured on MPE and induced with 0.5 µM rolipram. Treatment with rolipram promotes O4 and Mbp expression but addition of a specific Erk1/2 inhibitor blocks the differentiation-inducing effects: n = 3; ANOVA: O4 p > 0.05, MBP **p < 0.001; Dunnett's post hoc test MPE + R versus MPE + R + ERK1/2 inhibitor: p < 0.001; mean decrease O4 = 35%; mean decrease Mbp = 76%.
G. Bar graph demonstrating that the percentage of O4/Mbp-positive positive cells in the presence of MPE and induced with 0.5 µM rolipram decreases following treatment with a specific pharmacological inhibitor against p38Mapk: n = 3; ANOVA: O4 ***p < 0.0001, MBP ***p < 0.0001; Dunnett's post hoc test MPE + R versus MPE + R + p38Mapk inhibitor: p < 0.0001; O4 mean decrease = 42%; Mbp mean decrease = 87%.
J. Bar graph indicating that the percentage of O4/Mbp-positive positive cells in the presence of MPE, induced with 0.5 µM rolipram and treated with a Creb1 inhibitor decreases below levels of cells plated on MPE. n = 3; ANOVA: O4***p < 0.0001, MBP ***p < 0.0001; Dunnett's post hoc test MPE + R versus MPE + R + Creb1 inhibitor: p < 0.0001, mean decrease O4 = 82%; mean decrease Mbp = 100%.
E,F,H,I,K,L. Representative images of cells immunolabelled with O4 (red) and Mbp (green). Error bars: SEM. Scale bar = 30 µm.

