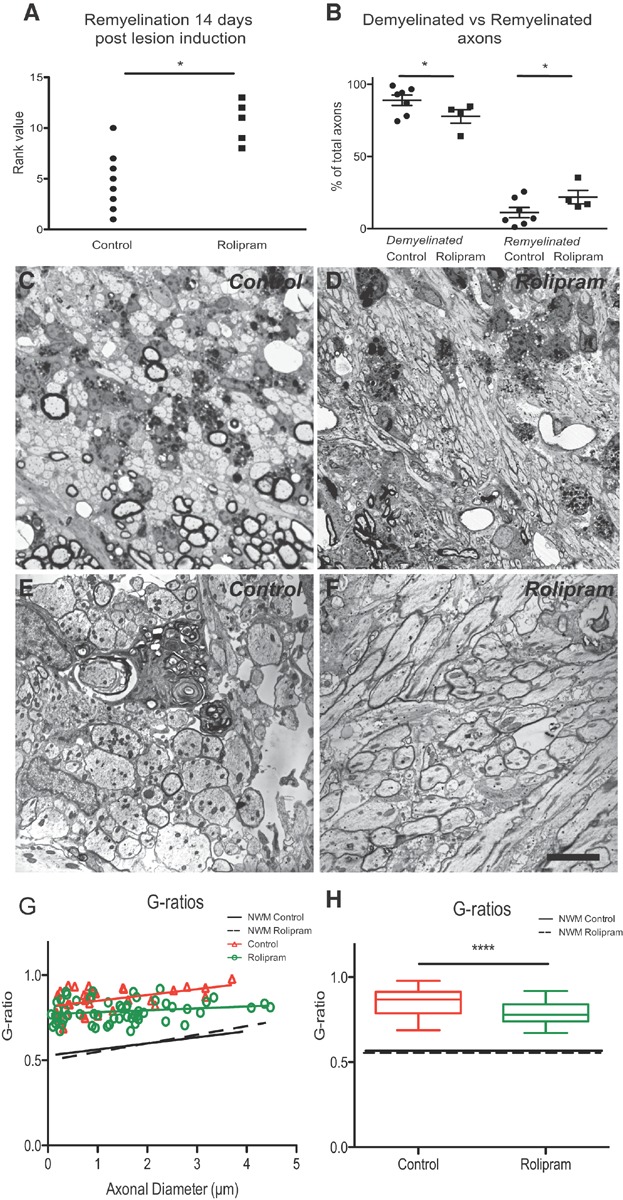
Figure 8.
Inhibition of Pde4 promotes CNS remyelination.
Rank analysis (Scatter plot) of remyelination in CCP lesions at 14 dpl assessed on toluidine-blue-stained semi-thin sections. Higher rank scores indicate greater extent of remyelination; control: n = 8, rolipram: n = 5, Mann–Whitney U test *p < 0.05.
Scatter plot representing quantification of demyelinated and remyelinated axons on electron micrographs. Control: n = 7, rolipram: n = 4, t-test: *p < 0.05.
Representative semi-thin and electron micrographs of (C,E) control and (D,F) rolipram-treated animals.
Scatter plot and Box plot of G-ratios indicating that remyelinated axons in rolipram treated animals have thicker myelin sheaths (lower G-ratios) than remyelinated axons in controls. (G-ratios of native myelin sheaths in both groups indicated by dotted lines.) Control: n = 34; rolipram: n = 58; t-test; ***p < 0.001; control: 0.8540 ± 0.01211; rolipram: 0.7871 ± 0.008436; Error bars: ± SEM. Scale bar C and D = 50 µm; E and F = 5 µm.