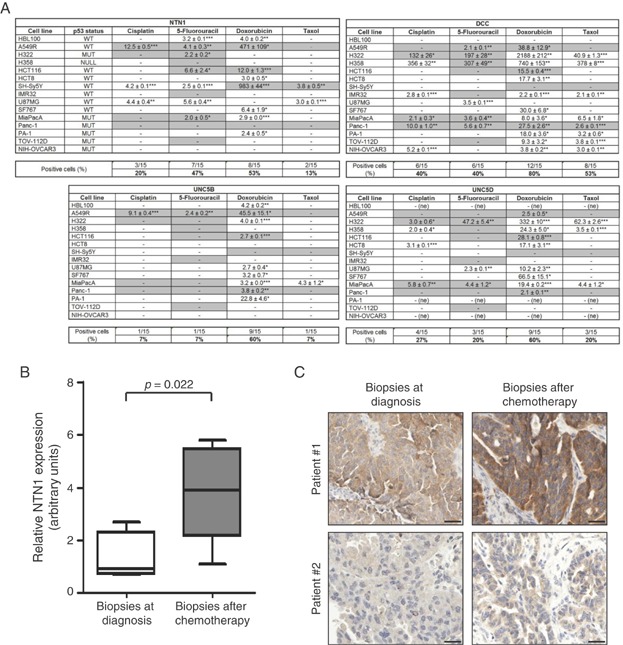
Figure 2.
Netrin-1 and its receptors expression is increased in several cancer cell lines and in ovarian tumours upon treatment with cytotoxic drugs.
Expression levels of netrin-1 (NTN1), DCC, UNC5B and UNC5D were measured by quantitative RT-PCR. Breast cancer (HBL100), lung cancer (A549R, H322, H358), colon cancer (HCT116, HCT8), pancreatic cancer (MiaPacA-2, Panc-1), neuroblastoma (SH-Sy5y, IMR32), glioblastoma (SF767, U87MG) and ovarian cancer (PA-1, TOV-112D, NIH-OVCAR3) cell lines were treated with classical chemotherapeutic drugs (Doxorubicin, Cisplatin, 5-Fluorouracil and Taxol), at different drugs concentration dependent on IC50 values calculated for each cell line and drug treatment for 24 h. Netrin-1 and its receptors gene expression was compared to control, not-treated cells, values indicate fold over control changes. Standard deviation and statistical analysis are also indicated. –, no changes or downregulation; n.e., not expressed. Positive cell lines were determined for gene expression variations more than twofold over control. Grey boxes represent resistant (i.e. more than 50% cell survival after treatment with maximal drugs concentrations) cancer cell lines. p53 status is indicated for each cell line (WT, wild-type p53; MUT, mutated p53; NULL, deleted p53).
Netrin-1 is over-expressed in ovarian tumour patients after chemotherapeutic treatment. Netrin-1 level, normalized with glyceraldehyde 3-phosphate dehydrogenase (GAPDH) gene, used as housekeeping gene, was analysed in RNA extracted from ovarian biopsies of tumours from patients obtained before and after a chemotherapeutic cycle of carboplatin/taxol treatment (n = 5 for each group). The median level of netrin-1 was calculated for each group. Mann–Whitney test was performed, and p-value is indicated.
Immunohistochemistry staining of two representive ovarian cancer biopsies, obtained before and after the conventional treatment. Original magnification, ×20. Scale bar: 50 µm. After chemotherapy, a high (patient 1) or intermediate (patient 2) intensity of the cytoplasmic staining indicated higher levels of netrin-1 as compared to staining obtained before treatment.