
Figure 1.
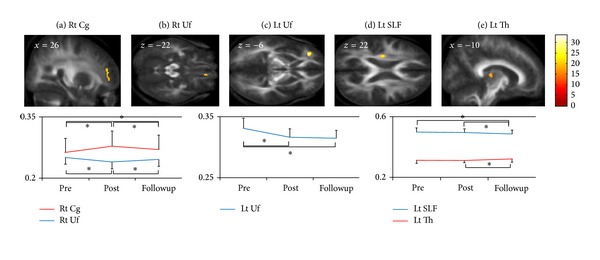
(a) FA in the right anterior Cg was significantly increased from pre to post (P < 0.05, paired t-test) and from pre to followup (P < 0.05, paired t-test), but it was significantly decreased from post to followup (P < 0.05, paired t-test). (b) FA in the right Uf was significantly decreased from pre to post (P < 0.05, paired t-test), but it was significantly increased from post to followup (P < 0.05, paired t-test). (c) FA in the left Uf was significantly decreased from pre to post (P < 0.05, paired t-test) and from pre to followup (P < 0.05, paired t-test). (d) FA in the left SLE was significantly decreased from pre to followup (P < 0.05, paired t-test) and from post to followup (P < 0.05, paired t-test). (e) FA in the left Th was significantly increased from post to followup (P < 0.05, paired t-test). These FA changes are illustrated by the plots at the bottom: vertical axes represent FA at peak voxels in each cluster, and horizontal axes indicate time periods. Error bars represent standard deviations. Colored bars represent F values. FA: fractional anisotropy; Rt: right; Lt: left; Cg: cingulum; Uf: uncinate fasciculus; SLE: superior longitudinal fasciculus; Th: thalamus.