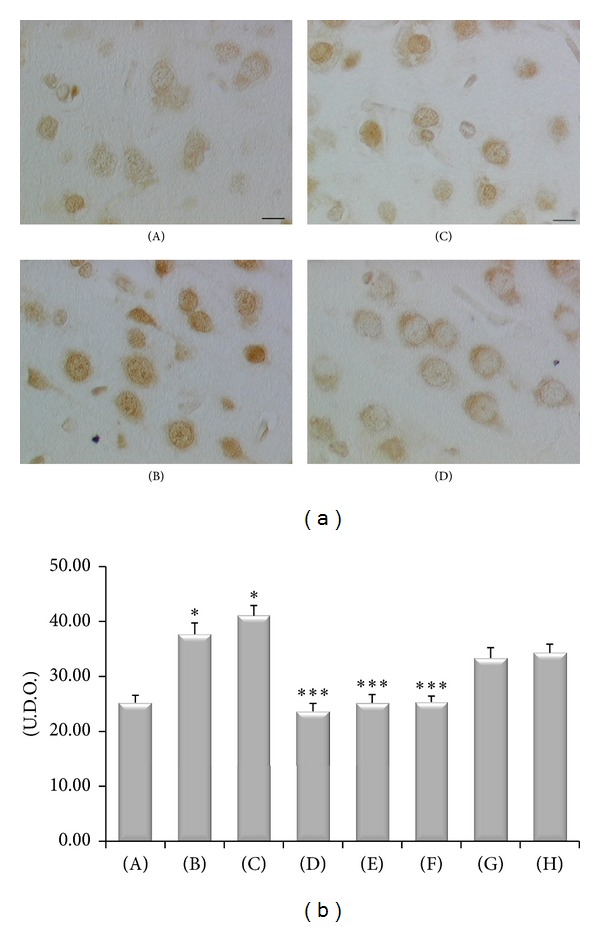
Figure 10.

8-Oxo-dG immunoreactivity in the cerebral cortex (layer VI) of the different animal groups investigated (a) and densitometric analysis of the intensity of immunoreaction (histogram). (A) WKY control Sham-operated rats, (B) control Sham-operated SHRs, (C) control CCI SHRs, (D) CCI SHRs treated with (+/−)-thioctic acid 250 μmol/kg/day, (E) CCI SHRs treated with (+/−)-thioctic acid 125 μmol/kg/day, (F) CCI SHRs treated with (+)-thioctic acid 125 μmol/kg/day, (G) CCI SHRs treated with (−)-thioctic acid 125 μmol/kg/day, and (H) CCI SHRs treated with pregabalin 300 μmol/kg/day (H). *P < 0.05 versus WKY control rats; ***P < 0.05 versus control CCI SHR. Calibration bar: 10 μm.
