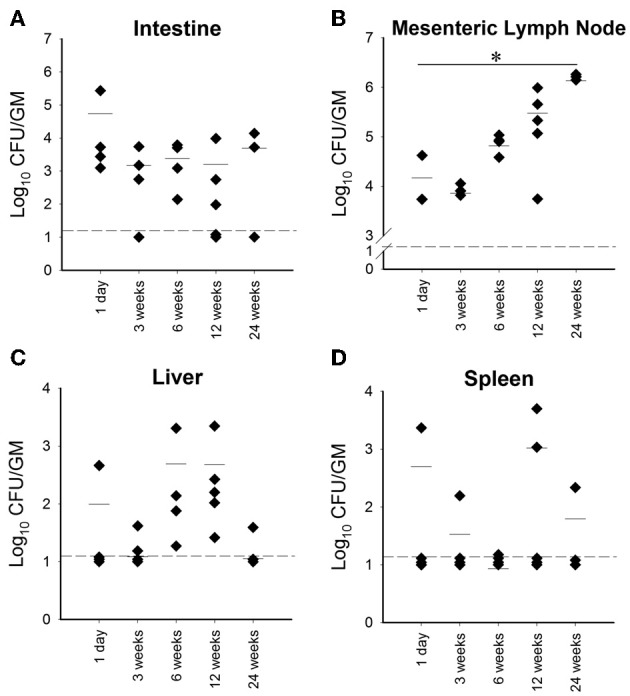
Figure 1.

Organ colonization from high dose orally infected mice. Graphs (A–D) (A, Intestine; B, Mesenteric lymph node; C, Liver; D, Spleen) depict CFU/g obtained from plating serial dilutions of homogenized organs (intestines, mesenteric lymph node, liver and spleen) from mice orally infected with two consecutive doses of 109 CFU of M. avium subsp. paratuberculosis K10 over a 24 week period. Each dot represents one mouse, the hash mark denotes the mean, and the dotted line represents the minimum detection limit. (*p < 0.05).
