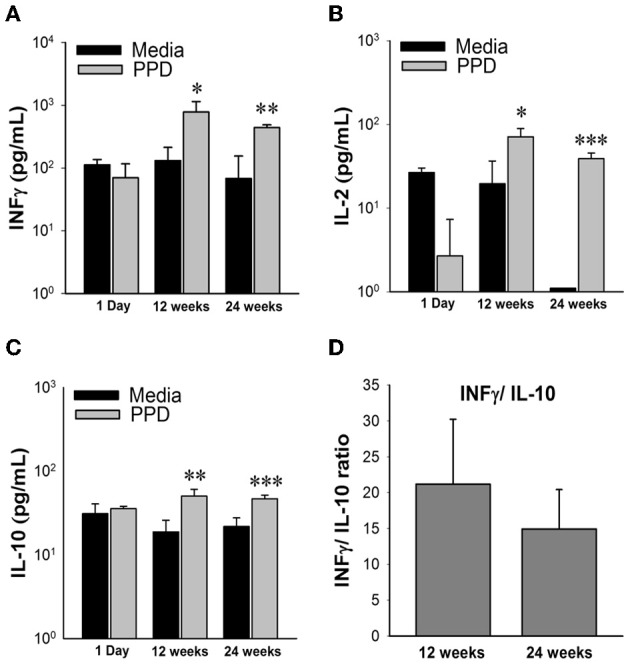
Figure 3.

Cytokine profiles of high dose M. avium subsp. paratuberculosis orally infected mice over 24 weeks post infection. Graphs (A–C) depict cytokine levels of mice orally infected with two consecutive doses of 109 CFU of M. avium subsp. paratuberculosis K10 over a 24 week period. At time of sacrifice, mouse spleens were collected and splenocytes were isolated and stimulated with Johnin Purified Protein Derivative (PPD) or media only for 48 h. Supernatant was collected and used for cytokine quantification by luminex bead array. Black bars represent the mean levels of media only background levels with their standard deviation and gray bars represent the mean levels from stimulation with PPD with their standard deviation. Significant increases in PPD stimulated splenocytes were determined by comparison to media only levels. (*p < 0.05, **p < 0.01, ***p < 0.001). To determine shifts in immune response from 12 to 24 weeks, levels of IFNγ were divided by IL-10 from individual mice (D). The mean ratio and standard deviation for each time point is shown.
