
Figure 7.
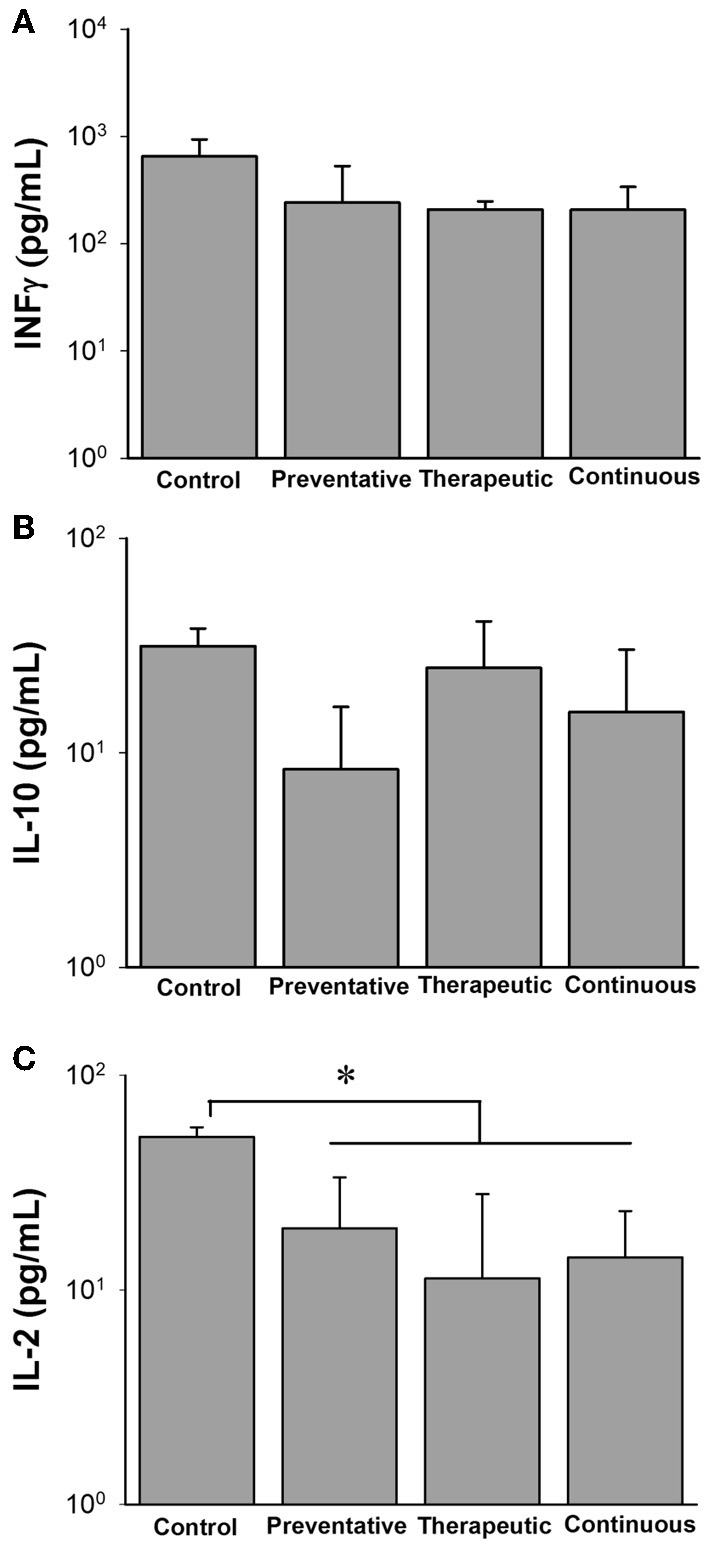
Cytokine profiles of different Lactobacillus casei ATCC 334 treatments at 12 weeks post oral M. avium subsp. paratuberculosis K10 infection. Graphs A–C (A. INFγ, B. IL-10, C. IL-12) depict cytokine levels of mice orally infected with two consecutive doses of 109 CFU of M. avium subsp. paratuberculosis K10 and treated with different ATCC 334 treatments. At 12 weeks post infection, mouse spleens were collected and splenocytes were isolated and stimulated with Johnin Purified Protein Derivative (PPD) or media only for 48 h. Supernatant was collected and used for cytokine quantification by luminex bead array. Graph bars reflect the mean of each treatment group and their standard deviation. Levels were calculated by subtracting individual PPD stimulated levels from their background levels. Significant differences among groups are reflected by *p < 0.05.