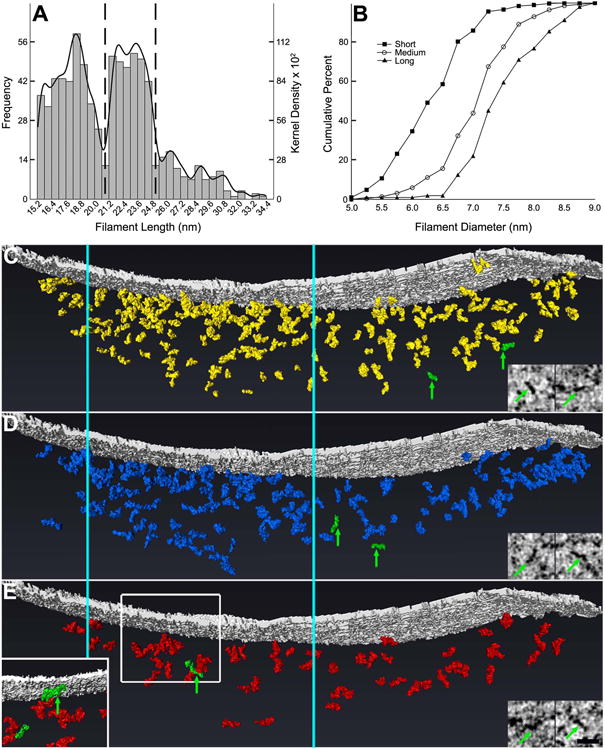
Figure 7. At least three classes of filaments contribute to the postsynaptic network at GABAergic synapses.

A, Frequency histogram of the lengths of rendered filaments with kernel density estimation. Histogram bars correspond to left y axis; kernel density estimation curve corresponds to right y axis. Local minima at 20.7 nm and 25.5 nm suggest that there are three distinct classes of filaments within postsynaptic networks of GABAergic synapses. Filaments were classified as short, medium, or long based on their lengths: dotted vertical lines illustrate the divisions between classes of filaments. B, Cumulative frequency curves for the diameters of short, medium, and long filaments illustrating significant differences between diameters of filament classes, with short filaments exhibiting the smallest diameters and long filaments exhibiting the largest. There is considerable overlap between classes, however. C-E, Short (C; rendered in yellow), medium (D; blue), and long filaments (E; red) are similarly distributed throughout the GABAergic postsynaptic network, with filaments most highly concentrated at the core (located between the vertical cyan lines that extend through C, D, and E) and least concentrated in the periphery. Representative filaments of each class are highlighted in green in the rendering and correspond to the filaments in the adjoining virtual sections. The inset in E depicts the boxed field rotated 180° about the vertical axis to visualize without obstruction one of the representative filaments (corresponding to the left virtual section in E). (Scale bar: 25 nm.)
