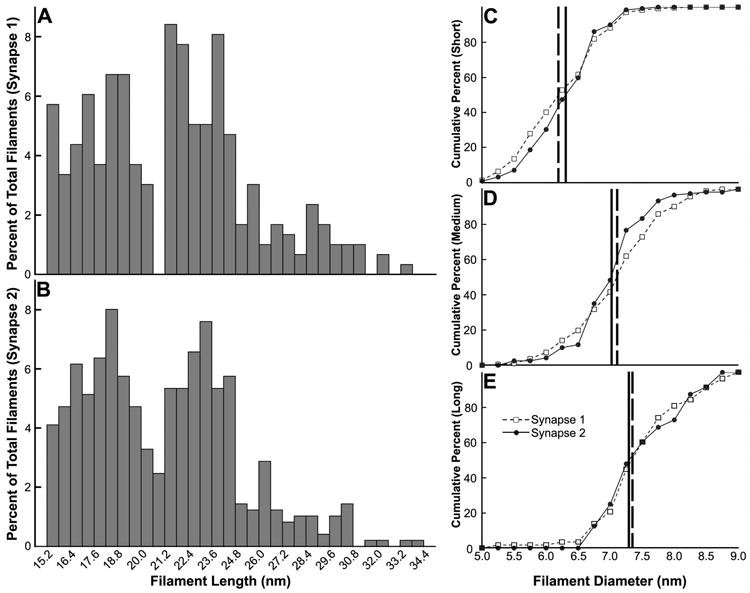
Figure 8. Postsynaptic filaments at two different GABAergic synapses exhibit congruent distributions of length and diameter.

A, B, Frequency histograms of the lengths of rendered postsynaptic filaments at the synapses rendered first (A) and second (B). C-E, Cumulative frequency curves for the diameters of short (C), medium (D), and long filaments (E) at the two synapses rendered. Vertical lines indicate the diameter at which 50% of the filaments at the synapses rendered first (broken line) and second (solid line) are accounted for.
