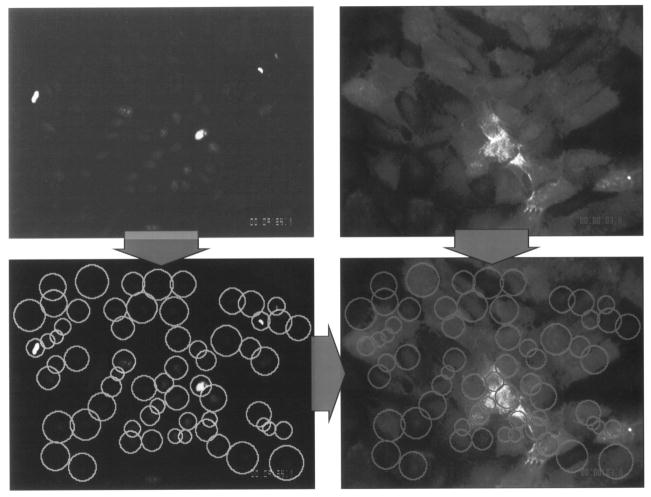
Fig. 3.
Targeted sampling fluorometry (TSF) allows the quantification of adhesion molecule expression over an intact cell monolayer on a cell-by-cell basis. At top are the two images acquired for analysis: the red nuclei are stained with propidium iodide and the adhesion molecule is labeled with fluorescein (green) using double immunostaining. The nuclei are first located in the propidium iodided channel, and regions of interest (ROIs) formed around each nucleus (bottom left); these ROIs are then applied to the immunostain image to find the fluorescence intensity in each region, corresponding to one cell. The procedure yields a histogram of intensities for the monolayer (adapted from Ref. [23]).

