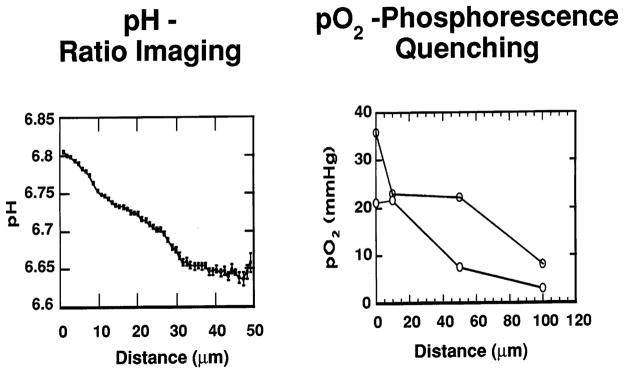
Fig. 6.

Spatial gradients of metabolites in tumors. (a) pH gradients measured using fluorescence ratio imaging microscopy (adapted from Ref. [54]). (b) pO2 gradients measured using phosphorescence quenching (adapted from Ref. [55]). Distance from the vessel wall, in microns, is shown on the x-axis, with zero being the vessel wall.
