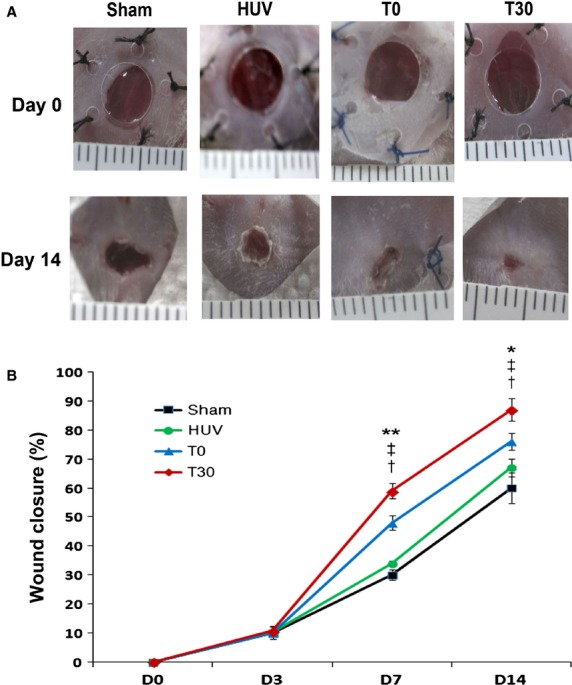
Figure 3.

In vivo wound closure analysis. (A) Representative images of the excisional wound splinting mouse model after transplantations of control vehicle medium (sham), T0 and T30 at days 0, 3, 7 and 14. (B) Wound measurements of each group in NOD/SCID mice (n = 12 per group). **P < 0.01 T30 versus T0, *P < 0.05 T30 versus T0, ‡P < 0.01 T30 versus HUV, †P < 0.01 T30 versus sham.
