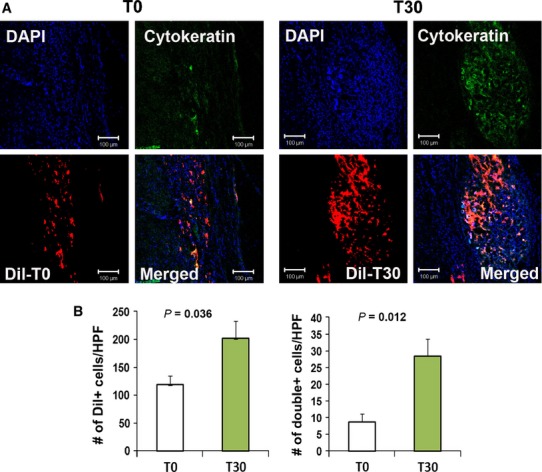
Figure 4.

Engraftment capacity of T30 cells. (A) Representative Images of localized Dil-labelled T0 and T30 cells. (B) Quantification of engrafted T0 and T30 cells. Dil-labelled cells were injected into the peri-wound areas of NOD/SCID mice and the wound area tissues were harvested 4 weeks after cell transplantation. Transplanted Dil-labelled cells in the wound area were quantified using histological analysis. The nuclei (n = 7 per group) were stained with DAPI (blue).
