Figure 5.

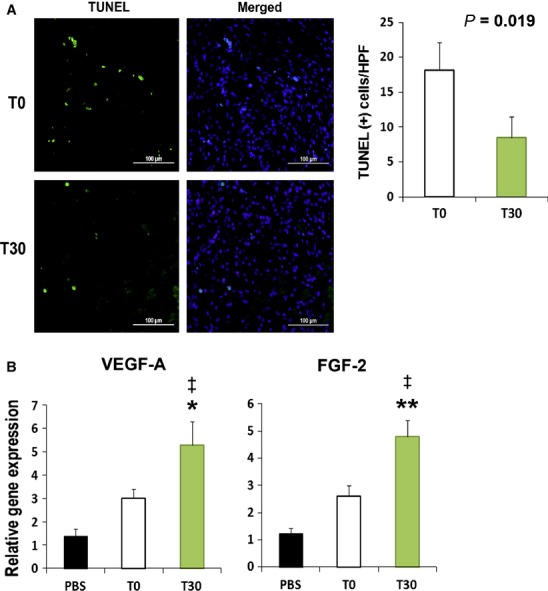
Apoptosis assay and angiogenic chemoattractant factors in skin wound tissues after cell transplantation. (A) Representative figures from TUNEL analysis. Quantification of TUNEL-positive (green fluorescence) nuclei after cell transplantation. The nuclei were stained with DAPI (blue fluorescence) in the skin wound at day 7. (n = 5 per group); bars: 100 μm. (B) Increased expression of angiogenic factors in tissues injected with T30. (n = 5 per group). **P < 0.01 T0 versus T30, *P < 0.05 T0 versus T30, ‡P < 0.01 PBS versus T30.
