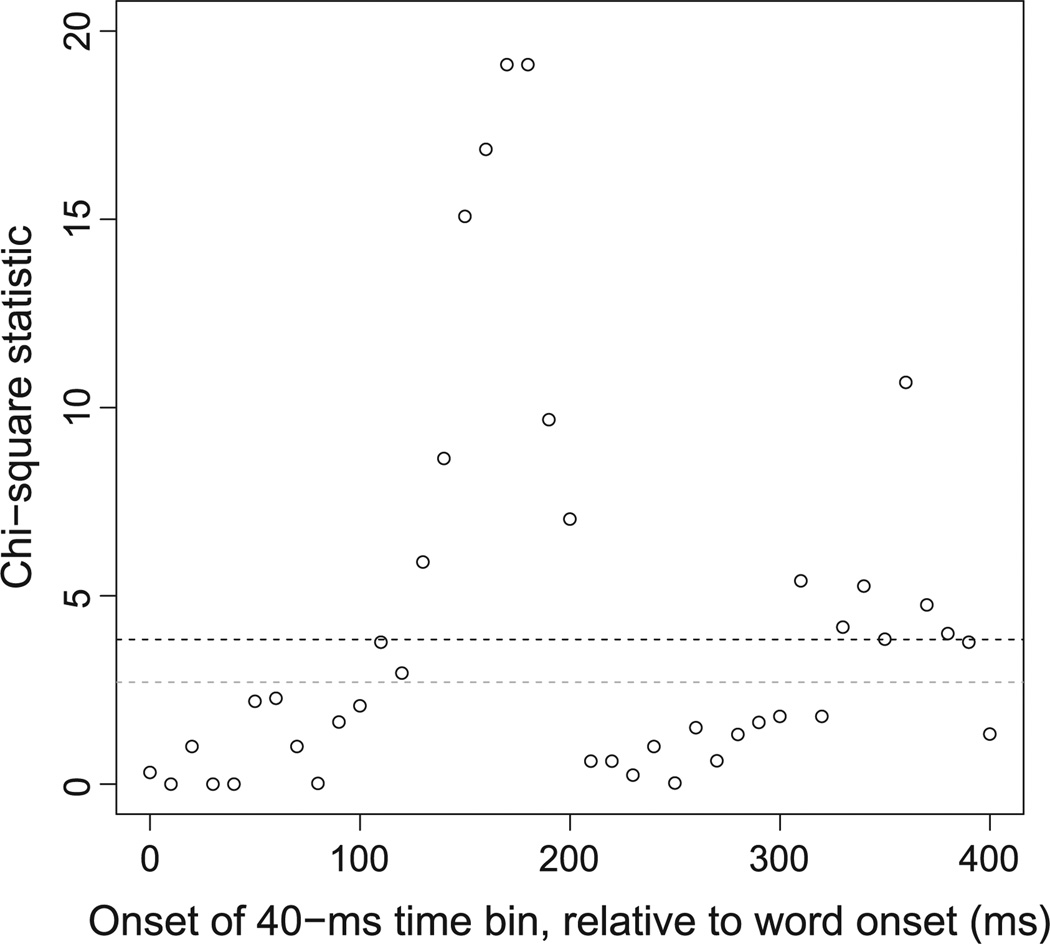
Fig. 10.
Moving-window analysis of saccade latencies in Experiment 2. Each data point represents the value of the Chi Square statistic comparing the number of trials with a saccade to the target vs. the number of trials with a saccade to the associated distractor, in a 40-ms bin, relative to the (estimated) onset of the target word. The black horizontal dashed line indicates the critical statistic for p < .05 with one degree of freedom (χ2 = 3.84); the gray horizontal dashed line indicates the statistic associated with a marginally significant effect (χ2 = 2.71).

