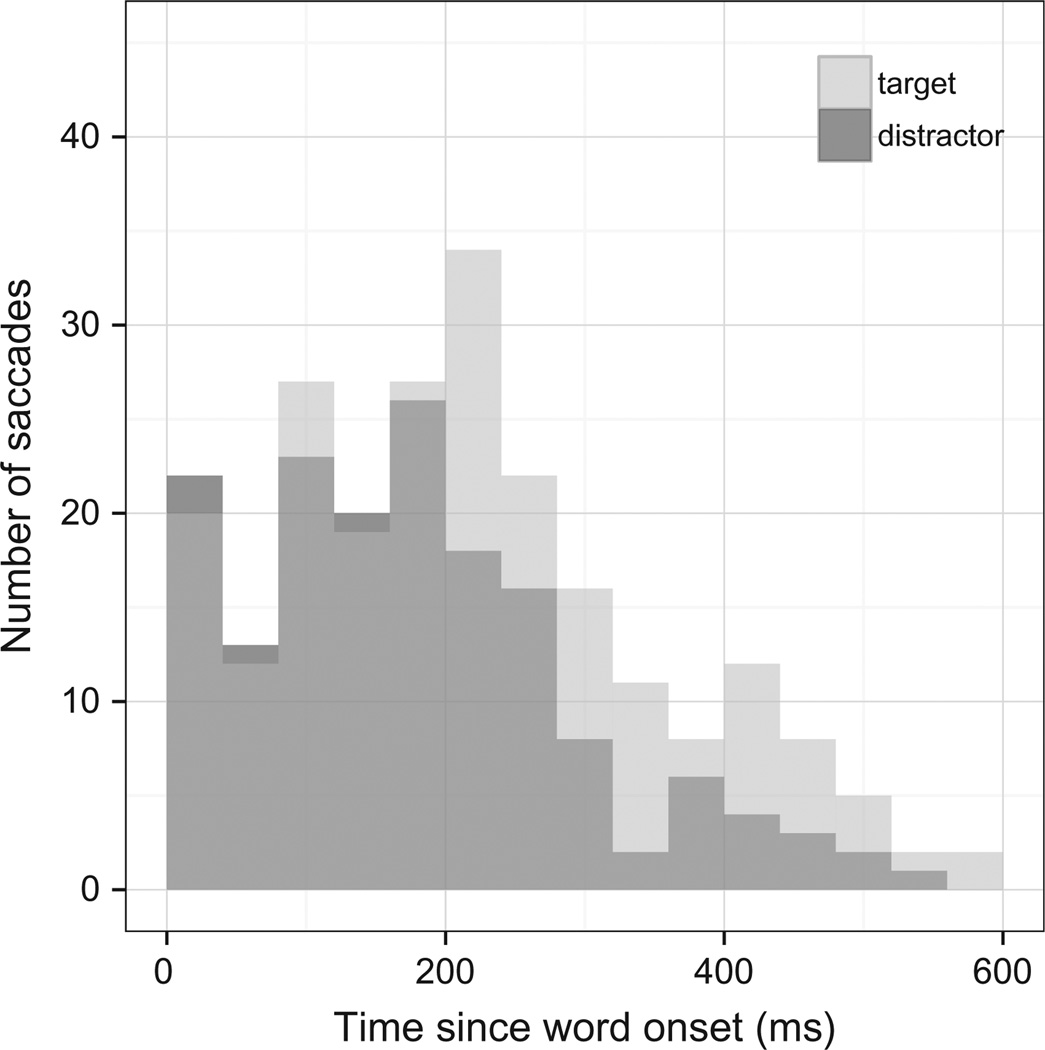
Fig. 3.
Histogram of saccade latencies for Experiment 1, in 40-ms bins. Note that the two distributions are transparent. The overlap between the distributions shows up as a mid-gray. For example, in the 0–40 ms bin there are 20 saccades to the target and 22 to the associated distractor; in the 200–240 ms bin there are 34 saccades to the target and 18 to the associated distractor.

