Figure 2.
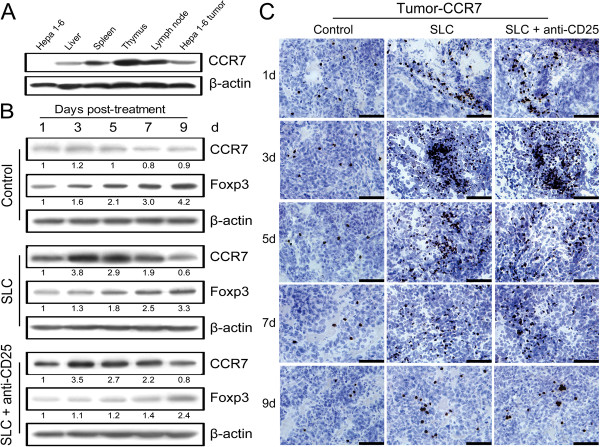
Dynamic changes of CCR7 and Foxp3 in tumors after the treatments. (A) Expression of CCR7 in Hepa 1–6 cells, tumors and immune organs. (B) Expression of CCR7 and Foxp3 in tumors on day 1 to 9 post-treatment. (C) Representative staining of CCR7 (dark brown) in tumors on day 1 to 9 post-treatment. Control: control group; SLC: SLC group; SLC + anti-CD25: combination therapy group. β-actin was used as a quantitative control. Densitometer quantitation was relative to the first data set in each case (indicated by a value of 1). All data are representative of at least two independent experiments. Bar = 50 μm.

