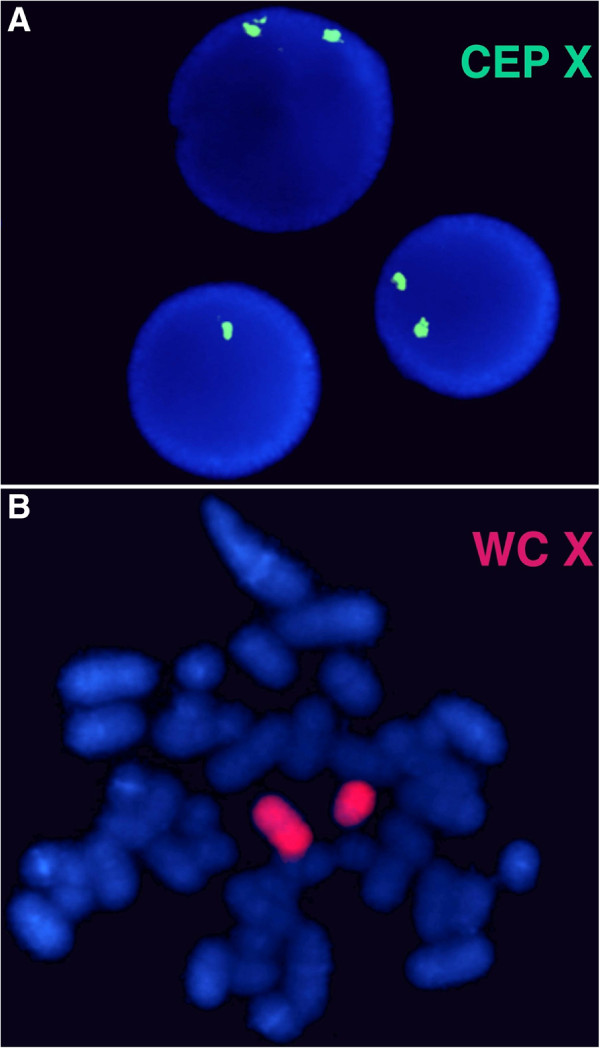
Figure 2.
FISH analysis. For FISH analysis using chromosome X centromere specific probe (CEP X) which shows normal female pattern (two green signals) in 90% of cells and X monosomy (one green signal) in 10% of interphase cells (a). The whole painting chromosome X (WC X) identified a normal and a smaller size red colored X chromosome and excluded the possible X chromosome translocation (b).

