
Fig. 2.—
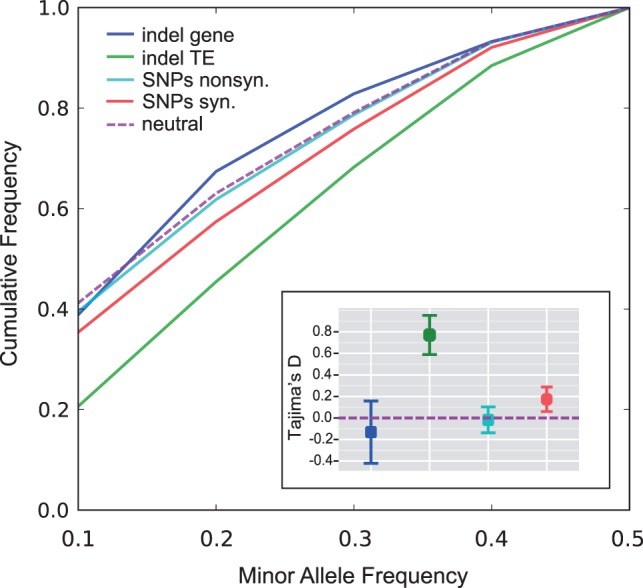
Allele frequency distributions in the ten resequenced lines. Cumulative frequency as a function of MAF is shown for genic and TE indels, synonymous and nonsynonymous SNPs, and a neutral coalescent simulation (neutral). Inset: Estimates of mean Tajima’s D color coded as in the main panel. Bars indicate the 95% confidence intervals as obtained by delete-one jackknifing the ten lines. Sample sizes are given in table 2.