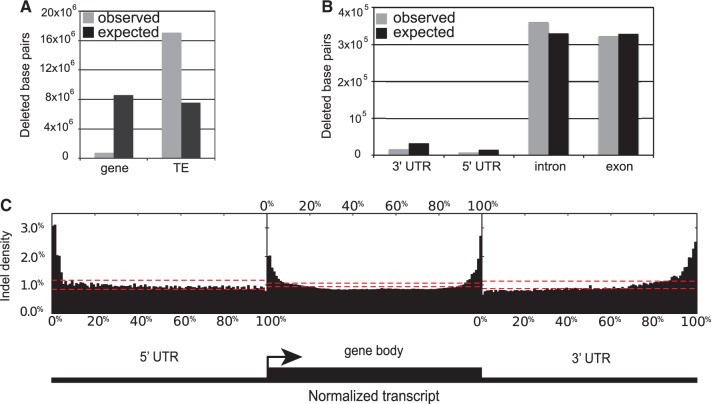
Fig. 3.—
Distribution of indel polymorphisms in genes and TEs. The observed and expected number of nucleotide sites in segregating indels among (A) genes and TEs, and (B) different gene components. (C) Indel density along a normalized transcript, using data from all annotated genes overlapping with segregating indels. Each genic region (5′ UTR, gene body consisting of exons plus introns, and 3′ UTR) was divided into 100 equally sized bins, and for each bin the relative density among all polymorphic indels was recorded (y-axis). The distribution of bin densities is expected to approximately follow a binomial distribution. The red dashed lines indicate the upper and lower 95% confidence bounds for a binomial distribution with P = 0.01 and n given by the total number of inserted/deleted base pairs observed in that region.

