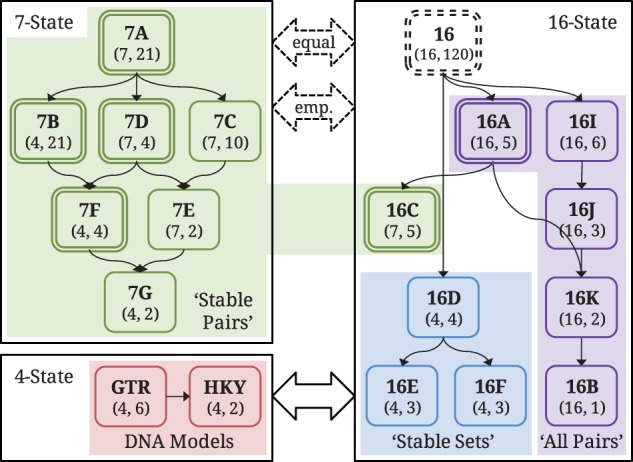
Fig. 1.—

Summary of the parameterization of RNA and DNA models and the relationships between them. The values below each model name are the number of frequency and exchangeability parameters, respectively. Double borders around models indicate that double substitutions are permitted. Arrows between models indicate nesting. The general 16-state model (dotted box) has too many parameters to be tractable and is not included in this analysis. The 4-state and 16-state models are directly comparable. The 7-state models require a likelihood adjustment value to account for the mapping from 1 mismatch state to 10, which can use either equal frequencies (0 degrees of freedom) or empirical frequencies (9 df).
