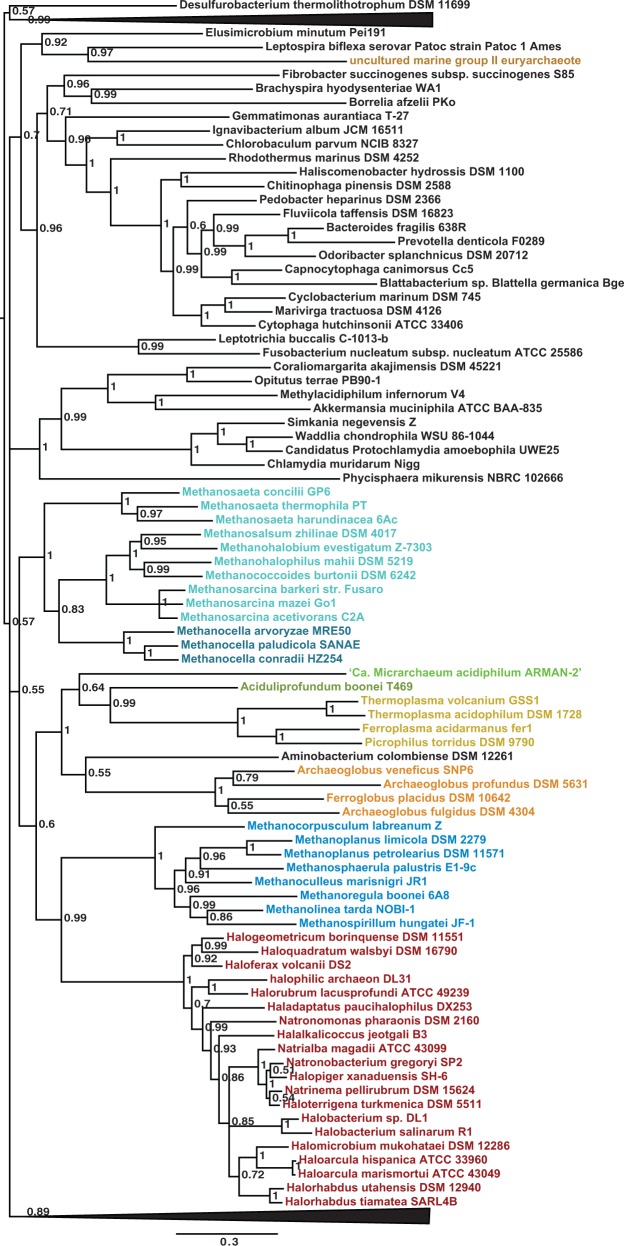
Fig. 7.—
Bayesian phylogeny of a concatenation of archaeal DNA gyrase small and large subunits and a selection of bacterial homologs (1,083 amino acid positions). The tree was calculated by MrBayes (MIX model + gamma4). The scale bar represents the average number of substitutions per site. Supports at nodes indicate posterior probabilities. Colors correspond to archaeal orders according to those used in figure 2. The tree is collapsed for clarity. See supplementary table S1 (Supplementary Material online) for accession numbers and taxonomic information.

