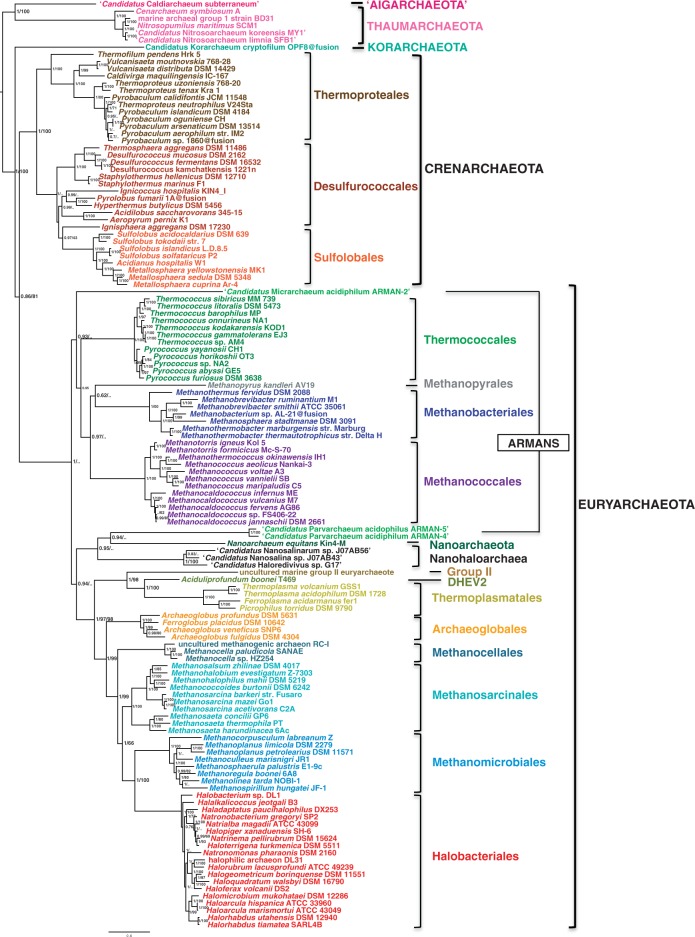
Fig. 8.—
Bayesian phylogeny of a concatenated data set of 14 replication components (4,295 amino acid positions). The tree was calculated by Phylobayes (CAT + GTR + gamma4). The scale bar represents the average number of substitutions per site. Values at nodes represent posterior probabilities and BV based on 100 resamplings of the original data set calculated by PhyML (LG model + gamma4), when the same node was recovered.

