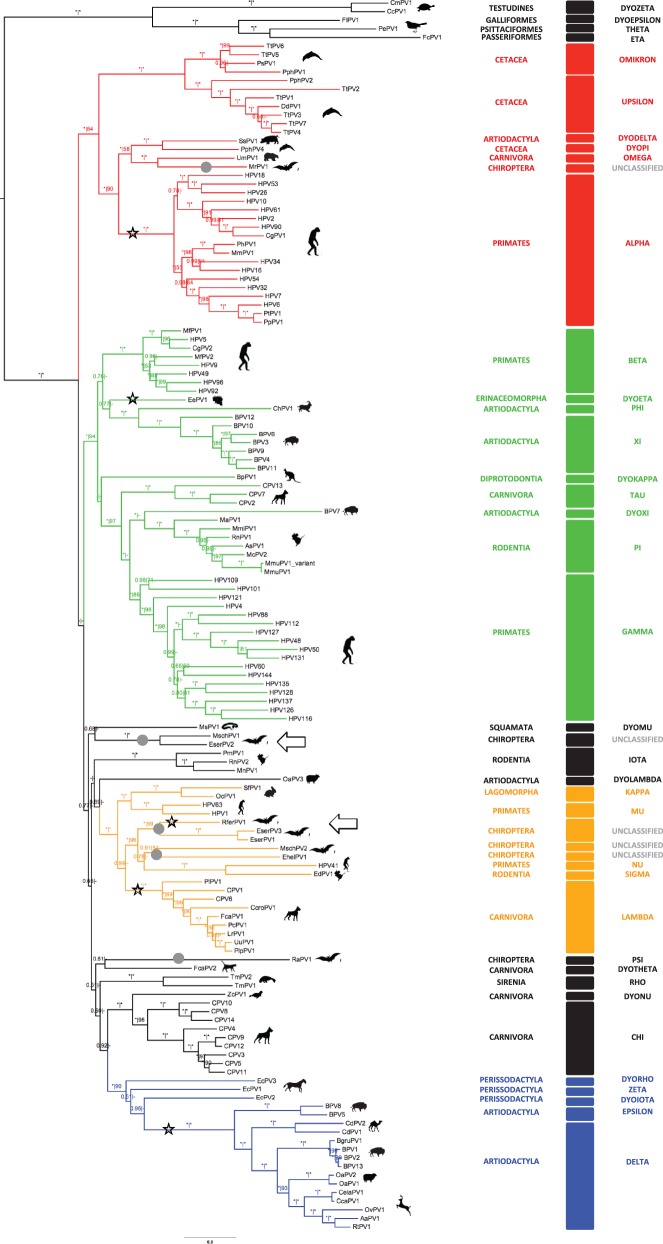
Fig. 1.—
Bayesian amino acid phylogenetic reconstruction for the E1–E2–L2–L1 concatenation. Branch lengths are drawn to scale, with the scale bar indicating the evolutionary distance in substitutions per site. Numbers above the branches indicate Bayesian posterior probabilities and ML bootstrap support values. Maximum support values are indicated with an asterisk (*), while values below 0.50 and 50 are indicated with a dash (-). Color code highlights the four PV crown groups: red, Alpha + OmikronPVs; green, Beta + XiPVs; blue, Delta + ZetaPVs; ochre, Lambda + MuPVs. Viruses whose detailed phylogenetic relationships could not be disentangled are labeled in black. Silhouettes represent the infected hosts. Taxonomic classification of both hosts (host order) and viruses (PV genera) are included. Gray dots highlight the five lineages encompassing bat PVs. Branches corresponding to clades or PVs that contain an E2–L2 region and may thus reflect individual recombination events are highlighted with a black star. The novel bat PVs described here are highlighted with black arrows.

