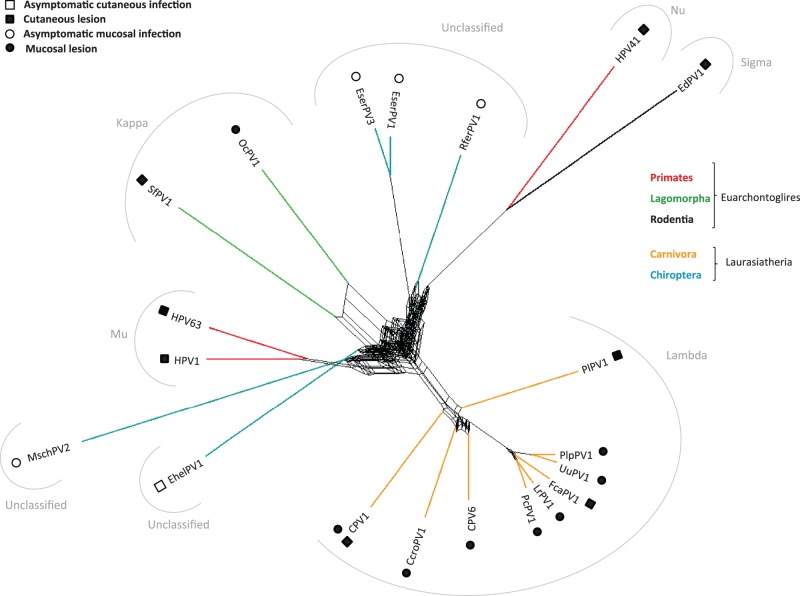
Fig. 2.—
Lambda + MuPVs supernetwork. The network was constructed using the best-known maximum-likelihood trees of each individual nucleotide PV gene (E6, E7, E1, E2, L2, and L1). Color code represents the different orders of the hosts. Specific PVs tropisms and outcome of the corresponding infections are indicated in the inset. PV genera are specified in gray.

