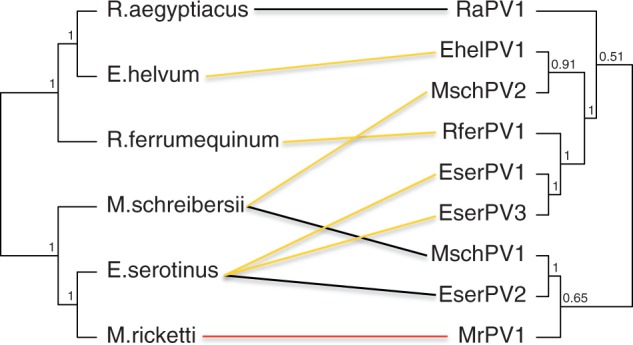
Fig. 4.—

Tanglegram linking the phylograms of bat PVs and their hosts. Congruence between the phylogenetic relationships among host bat species after Bayesian inference (left) and bat PVs after maximum likelihood inference (right). Please note that the PV taxa depicted here are representatives of highly polyphyletic PV crown groups. Color code for the lines linking both phylograms corresponds to colors used in figure 2 for the different PV crown groups.
