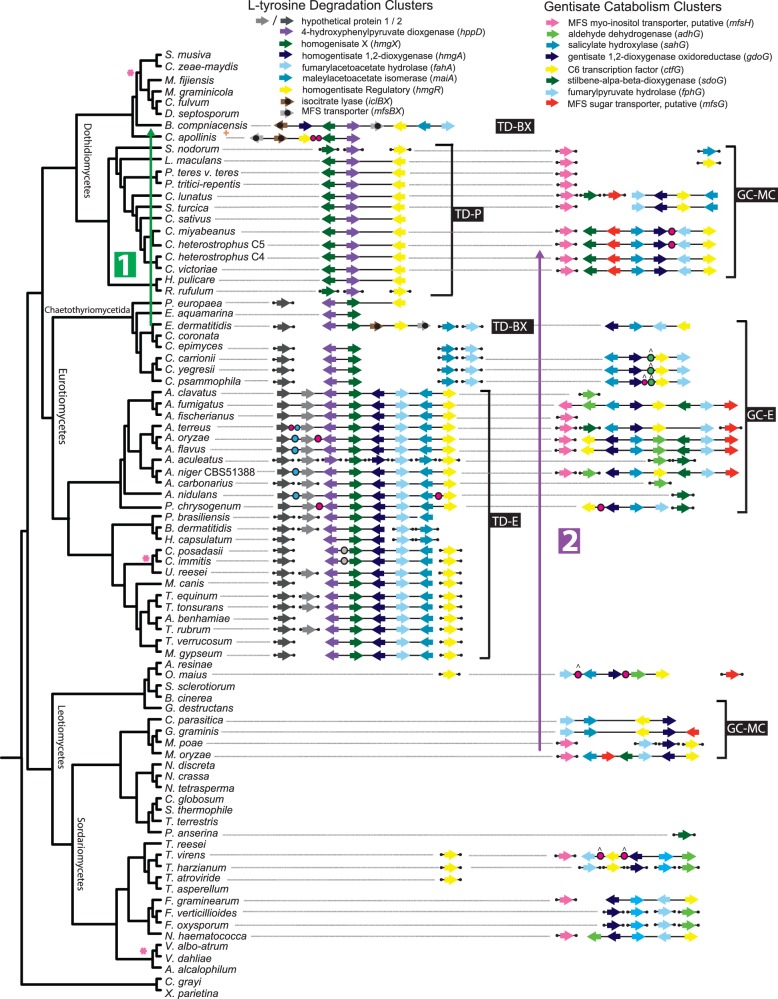
Fig. 2.—
Distribution of two specialized tyrosine metabolism gene clusters in Ascomycete fungi. The rpb2 phylogeny (left panel) depicts species relationships among the lineages beside homologs of the l-tyrosine degradation (TD) gene clusters (middle panel) and gentisate catabolism (GC) gene clusters (right panel). Gene colors indicate homology with the query genes in A. fumigatus; absence of gene arrows for taxa denotes absence of these orthologs from their genomes. Clustering is indicated by solid lines connecting genes. Homologs that are not clustered are indicated by detached line segments. Specific gene cluster types defined first by clades in gene trees then by shared synteny are indicated with brackets. Genes with black dots in B. compniacensis and E. dermatitidis TD gene clusters were not part of the initial query. The first of these (brown) is isocitrate lyase (iclBX), and the second (gray) is an MFS transporter gene (mfsBX). The pink asterisk denotes that a homolog of MFS myo-inositol transporter of the GC gene cluster was detected for all species in the indicated clade. Dots in clusters represent other intervening genes not found in the A. fumigatus query: magenta dots represent unique intervening genes, and all other colored dots represent homologs (i.e., the blue dots in Aspergillus clade are homologous). Dots with carets above them indicate the presence of 2–6 intervening genes. Labeled arrow 1 indicates a horizontal transfer of a TD-BX gene cluster from a relative of E. dermatitidis (Eurotiomycetes) to B. compniacensis (Dothideomycetes) and labeled arrow 2 indicates a horizontal transfer of a GC-MC gene cluster from a relative of Magnaporthe spp. (Sordariomycetes) to Pleosporineae (Dothideomycetes).

