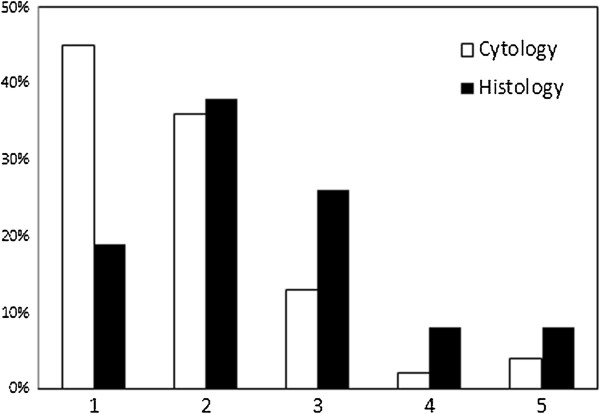
Figure 1.

Distribution into tissues of origin (in percentage) for the cytological- and histopathological diagnosed data-sets. Origin: 1: Mesenchymal origin, 2: Hematopoietic/lymphoid origin, 3: Epithelial origin, 4: Neuroectodermal origin, 5: Other origins (gonadal, glial, NOS).
