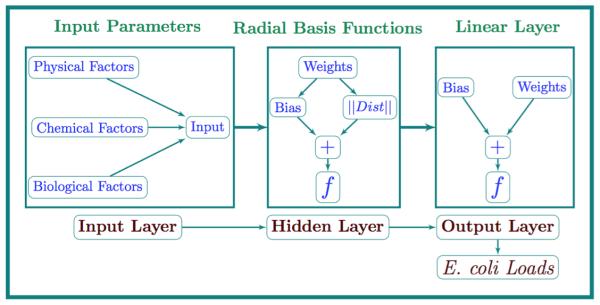
Figure 1.

The graphical structure of BNN representing cause-and-effect relationship between system variables (water quality parameters) and the E. coli loads. The Radial Basis layer is the hidden layer, which uses the transfer function f (thin plate spline); the output layer is a linear layer, which uses the transfer function f (linear function). The transfer function f establishes a relationship between inputs and outputs, in case of estimation of E. coli loads, thin plate splines works better than other transfer functions (Gaussian or r4 functions).
