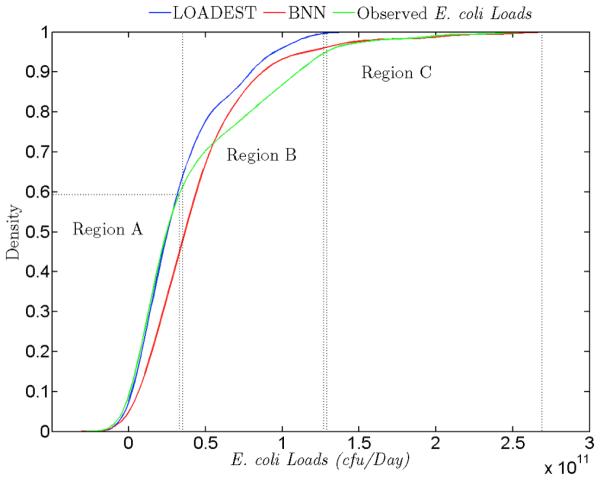
Figure 7.

The cumulative density functions of the observed E. coli loads, estimated E. coli loads by the BNN, and estimated E. coli loads by the LOADEST are presented above. There are three regions in the figure. The region A signifies that the LOADEST model is able to estimate E. coli loads better. In the region B and C, the BNN model predicts better than the LOADEST model.
