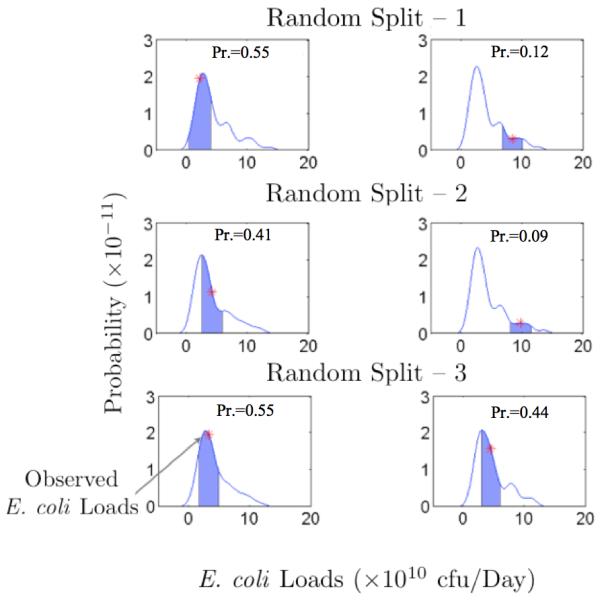
Figure 8.

Probability distributions of low (left panels) and high (right panels) E. coli loads of each random split by the BNN model. PDFs show that higher loads are associated with multi-modality. The blue shaded area (Pr.) represents the probability of observed E. coli loads with in ± 10% uncertainty bands.
