


Figure 2.
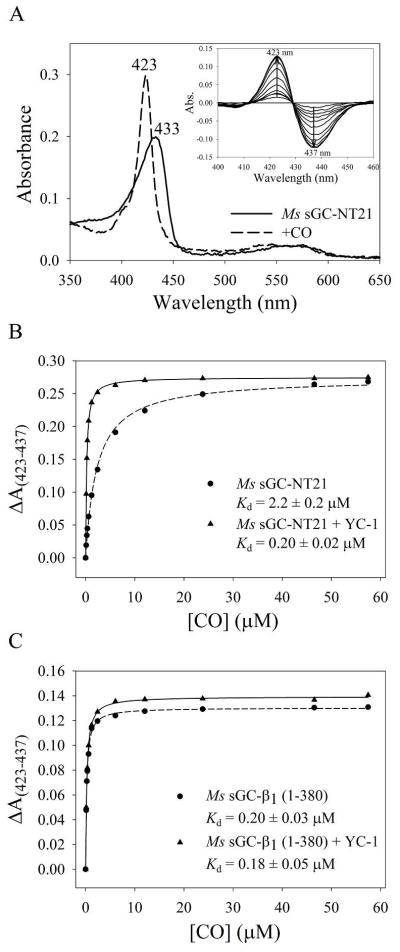
CO saturation binding analysis. (A) Absorption spectra of purified Ms sGC-NT21 before and after CO saturation. The A433/A280 ratio for the unliganded protein is ~1.8, consistent with high purity and full heme incorporation. Inset: difference spectra for Ms sGC-NT21 upon CO titration. (B) CO saturation binding curve for Ms sGC-NT21 ± YC-1, which displays a 10-fold tightening of the CO-dissociation constant upon YC-1 binding. (C) CO saturation binding curve for Ms sGC-β1 (1–380) ± YC-1, which displays little change in CO binding affinity upon YC-1 binding. Titrations were performed in a 10 cm cuvette at room temperature with 0.1 μM protein in buffer containing 50 mM potassium phosphate, pH 7.4, 100 mM KCl, 5% glycerol, and 50 μM YC-1. The data were corrected for dilution upon addition of CO-saturated buffer and were fitted to a single-site saturation model to obtain the CO dissociation constants.