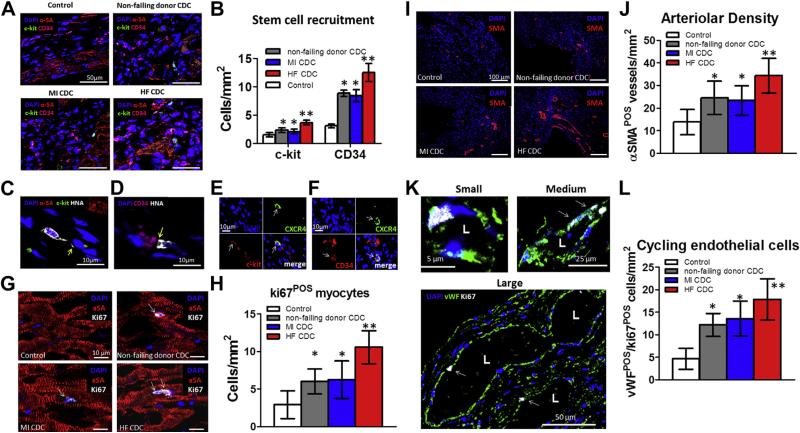
Figure 7. Recruitment of Stem Cells, Cardiomyocyte Cell-Cycle Re-Entry, and Angiogenesis.
(A) Representative confocal images showing c-kit+ (green) and CD34+ (magenta) stem cells in the infarct border zone. Cardiomyocytes were stained with alpha-sarcomeric actin (α-SA; red). (B) Quantitation of c-kit+ and CD34+ cells (n = 3 hearts per group). *p < 0.05 compared with Control; **p < 0.05 compared with all other groups. Large magnification revealed interactions (yellow arrow) between transplanted HF CDCs with c-kit+ (C) or CD34+ cells (D). (E) Co-expression of CXCR4 (green) in c-kit+ cells (red). (F) Co-expression of CXCR4 (green) in CD34+ cells (red). (G) Cardiomyocytes (stained with α-SA; red) containing Ki67+ nuclei (white) in the infarct border zone. (H) Quantitation of Ki67+ cardiomyocytes in each group (n = 3 hearts per group). (I) Arteriolar structures stained with SMA (red) in the infarct border zone. (J) Quantitation of arteriolar density in each group (n = 3 hearts per group). (K) cycling endothelial cells stained with ki67 (white) and vWF (green). (L) Quantitation of cycling endothelial cells in each group (n = 3 hearts per group). *p < 0.05 compared with Control; **p < 0.05 compared with all other groups. Data are presented as means ± SD. Abbreviations as in Figures 1 and 6.

