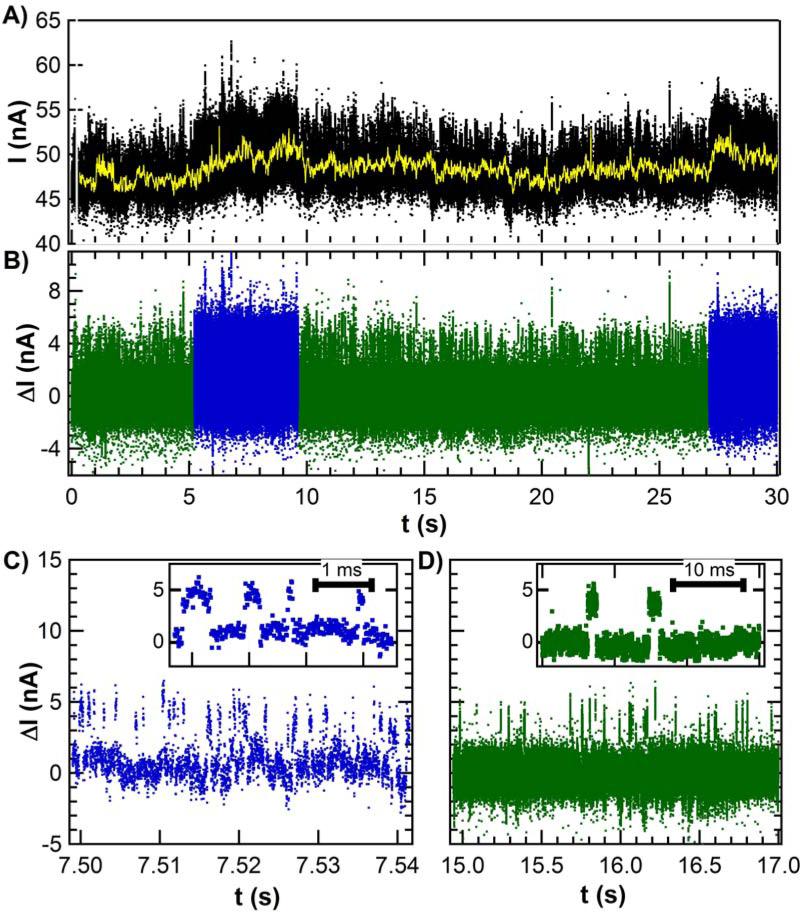
Figure 2.
(A) Long duration I (t) sequences exhibit dynamic noise on top of low frequency fluctuations (yellow line) having a 1/f distribution. (B) Subtracting the meandering mean produces a filtered data set that clarifies the fluctuations as two-level, simplifies further analysis, and reveals that the two-level switching rates vary over 5 – 15 second periods. (C) The faster RTS oscillates about 300 times per second, whereas (D) the slower RTS oscillates 15 times per second. The insets show individual switching events for each case.

