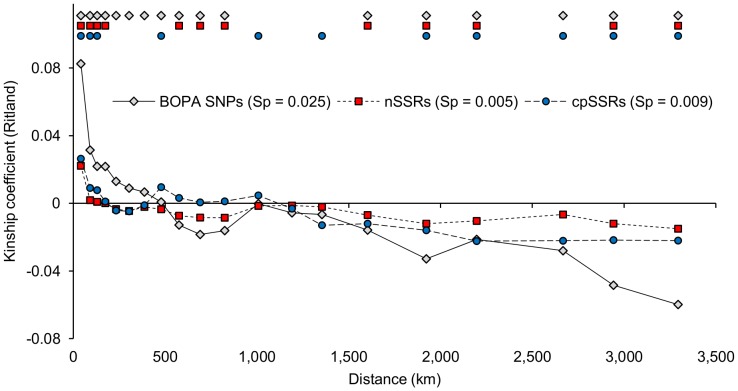
Figure 2. Spatial autocorrelation analysis profiles for wild barley accessions based on BOPA SNPs, nSSRs and cpSSRs.
Geographic distances on the x-axis are the mean values of distance classes. The symbols at the top of the figure mark observations significantly larger or smaller (P≤0.01) than the average for distance classes. Values for the Sp statistic, calculated from the regression slope of the graph and the kinship coefficient of the first distance class [76], are also shown. Placing all three data sets on the same graph allows profiles to be compared. Increases in similarity at a distance class of around 1,000 km, and an earlier additional increase for cpSSRs at around 500 km, illustrate that a simple isolation-by-distance model is not sufficient to describe genetic variation in wild barley.

