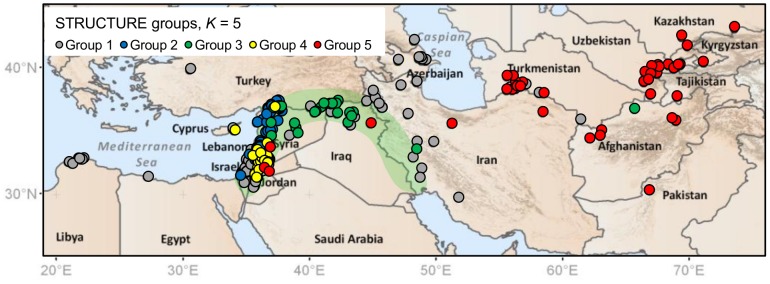
Figure 3. STRUCTURE group assignments for individual wild barley accessions.

The results shown are based on K = 5 and for BOPA SNPs. The results for nSSRs (not shown) were similar. Results correspond with spatial autocorrelation analysis (Fig. 2) in describing a more complex genetic structure in wild barley than might be expected with a simple isolation-by-distance model.
