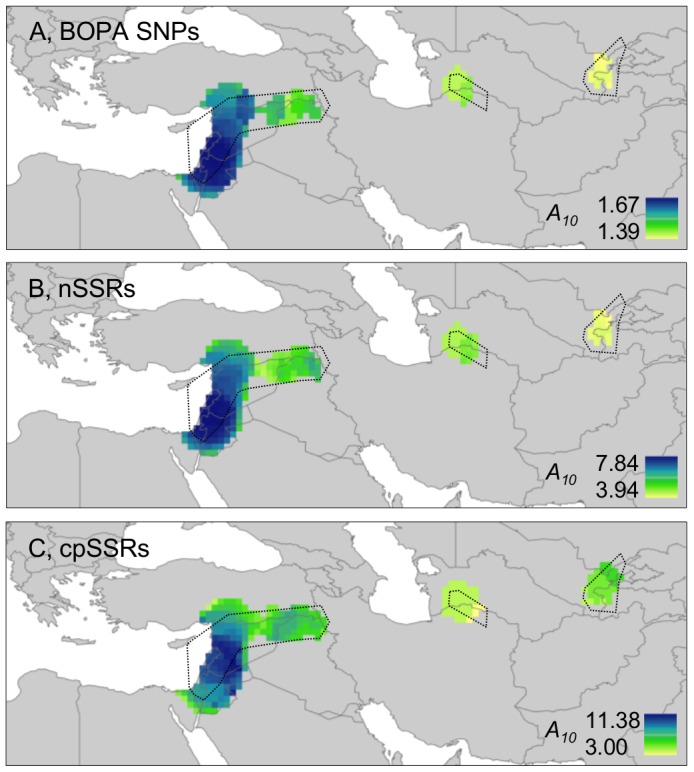
Figure 4. Allelic (A and B) and haplotype (C) richness (A10) maps for wild barley.

BOPA SNPs, nSSRs and cpSSRs all indicate the Eastern Mediterranean region as more diverse (highly diverse areas = dark blue) than Central Asia. As expected, nSSRs with high allelic diversity and cpSSRs with multiple haplotypes reveal relatively higher richness values within neighbourhoods (A10 as high as 7.84 and 11.38, respectively) than biallelic BOPA SNPs (maximum A10 = 1.67). Not all of the original sample range could be included in analysis because of the required minimum sampling intensity to calculate a standardised diversity value (see Materials and Methods; compare the current figure with Fig. 1). Accessions included in analysis in a particular geographic area are circumscribed by a dotted line. A, 2,426 from 2,505 BOPA SNPs used in calculations (SNPs excluded with ≥25% missing data in one or more grid cells); B, all 24 nSSRs used in calculations; C, all cpSSR haplotypes used in calculations.
