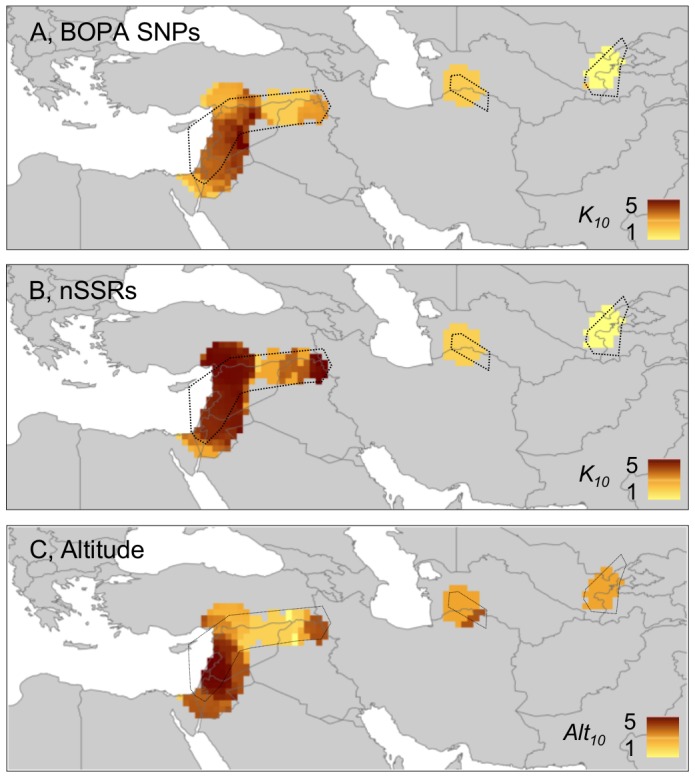
Figure 5. STRUCTURE group richness (A and B, K10) and ‘altitude richness’ (C, Alt10) maps for wild barley.

A and B, richness estimates for BOPA SNPs and nSSRs, respectively, K = 5 in STRUCTURE analysis. Both marker sets indicate the Eastern Mediterranean region as more diverse (highly diverse areas = dark brown) than Central Asia. C, ‘altitude richness’ of wild barley sample sites, based on five altitude categories (<200 m, 200 to 600 m, 600 to 1,000 m, 1,000 to 1,400 m, >1,400 m). Altitude data provide an indication of environmental heterogeneity and were downloaded from WorldClim (www.worldclim.org/; values given in Table S1). Unlike the 19 bioclimatic variables used elsewhere in the current study, altitude data are actual values rather than interpolations from weather station records, so they are particularly appropriate for assessing real environmental heterogeneity [22], [77]. Altitude richness estimates indicate sample points in the Eastern Mediterranean region as more diverse than those in Central Asia. Not all of the original sample range could be included in analyses because of the required minimum sampling intensity to calculate standardised diversity values (see Materials and Methods; compare the current figure with Figs. 1 and 3 [individual STRUCTURE K group assignments], see also Fig. 4). Accessions included in analyses in a particular geographic area are circumscribed by a dotted line. The analysis to generate ‘altitude richness’ was carried out in the same way as for STRUCTURE group richness, except ‘altitude category’ substituted for ‘STRUCTURE group’.
