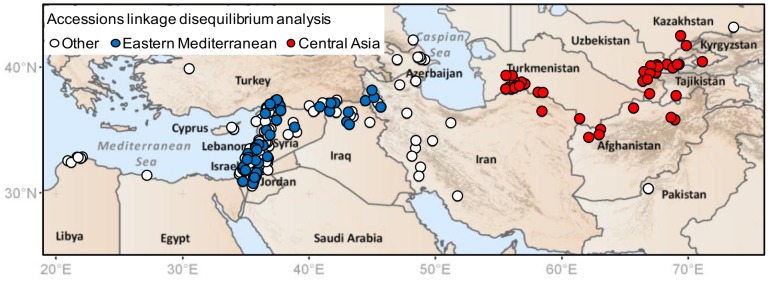
Figure 7. Locations of wild barley individuals sub-sampled from two regions for testing of linkage disequilibrium (LD).

For LD assessment, forty accessions were chosen at random from the Eastern Mediterranean and Central Asia regions, across an approximately equal-dimensioned geographic area to minimise confounding sample size and dimensional effects in analysis (a significant issue in LD calculations [26]). In the case of the Eastern Mediterranean region, to ensure similar geographic coverage to Central Asia, sampling was extended eastward away from the coast below the peak of the Fertile Crescent into northwestern Iran. The coordinates of the accessions sampled for LD analysis are given in Table S1. Compared to the Eastern Mediterranean sub-sample, that from Central Asia had a less variable environment across accession collection sites (see Fig. 5C and the bioclimatic variables given in Table S1). Furthermore, climate modelling suggested a much greater proportion of accessions in the Central Asian sub-sample to be associated with range expansion since the LGM (see Fig. 6D and Table S1). Consistent with genetic diversity levels expressed on maps (Figs. 4, 5A, 5B), the latter sub-sample also had lower nuclear diversity according to FSTAT 2.9.4 [61] calculations (nSSR allelic richness for the Eastern Mediterranean sub-sample = 10.44, for Central Asia = 7.44, corrected by rarefaction to a sample size of 36 complete genotypes across all nSSRs; P<0.001 based on a two-tailed t-test of individual locus allelic richness values undertaken in EXCEL). Another factor that can confound LD comparisons is differences in allele frequency distributions between samples. We therefore tested allele frequency profiles for our two sub-samples, and found them to be similar (proportion of markers with a minimum minor allele frequency between 0.1 and 0.3 was 0.493 and 0.499 for the Eastern Mediterranean and Central Asia areas, respectively).
