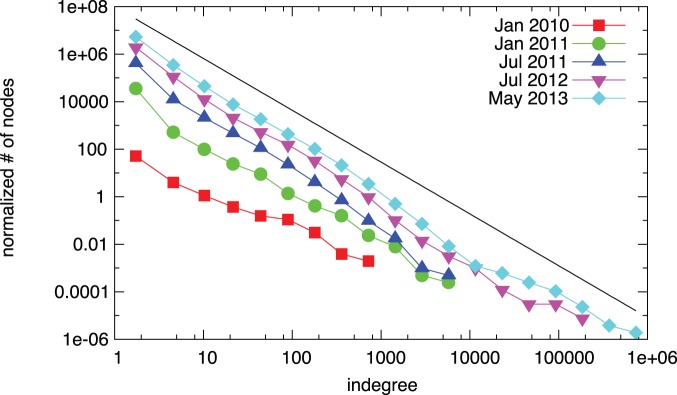
Figure 2. Evolution of the indegree distribution.

Since the beginning of 2011, the shape of the distribution does not change significantly. The black line shows a fitted power-law for the final network; the exponent is  . The data is log-binned for ease of visual inspection, the power-law is fitted on the original data [18].
