
Figure 9. Evolution of the distribution of balances of individual Bitcoin addresses.
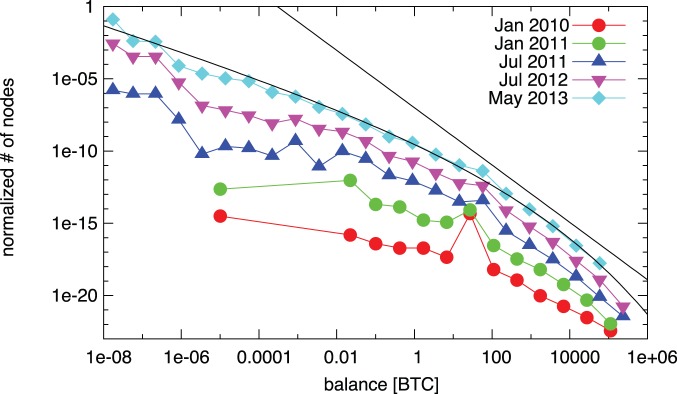
The distributions are shifted by arbitrary factors along the vertical axis for better visibility of the separate lines. The black lines are stretched exponential and power-law fits of the last empirical distribution. The tail can be approximated by a power-law with exponent  , however, the rest of the fit is unsatisfactory. Therefore, we fit the distribution with a stretched exponential distribution of form
 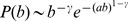 . We find a better approximation of the whole distributions; the parameters are
  and
and 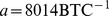 .
.