
Figure 12. Average node balances as a function of the indegrees.
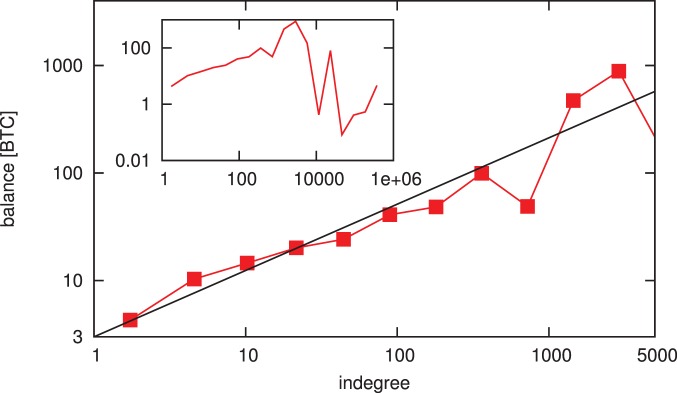
We calculate the averages for logarithmically sized bins. We find strong correlation between the balance and the indegree of individual nodes. The main plot shows indegree values up to  , only 75 nodes (
 ) have higher indegree, the averages calculated for such small sample result in high fluctuations (see inset). We also measure both the Pearson and Spearman correlation coefficient: The Pearson correlation coefficient of the full dataset is
  , while the Spearman rank correlation coefficient is
  . (Note that the Pearson correlation coefficient measures the linear dependence between two variables, while the Spearman coefficient evaluates monotonicity). We test the statistical significance of the correlation by randomizing the dataset 1000 times and calculating the Spearman coefficient for each randomization. We find that the average Spearman coefficient is
  with a standard deviation of
  , indicating that the correlation is indeed significant.