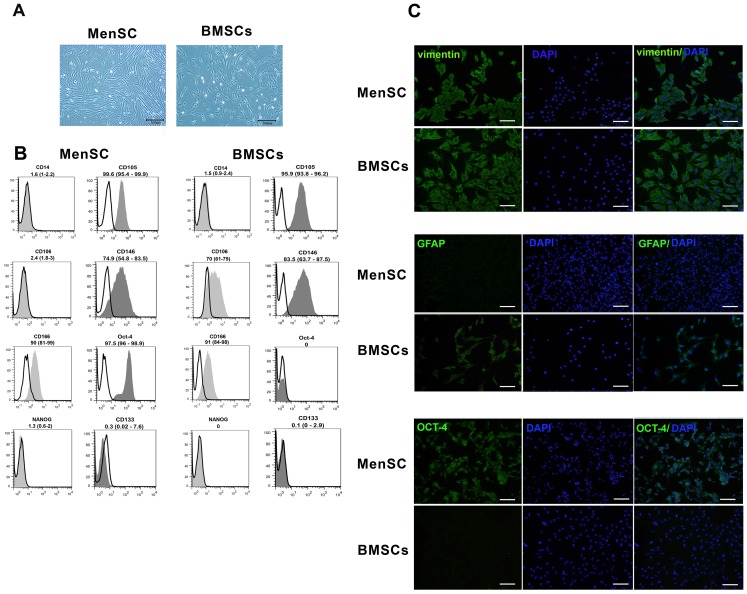
Figure 2. Phenotypic characterization of the MenSCs and BMSCs.
(A) Morphological appearance of cultured MenSCs and BMSCs at passage 1; Scale bar: 100 µm. (B) Representative histograms of MenSC and BMSCs immunophenotyping by flow cytometry. CD markers are demonstrated in gray and the respective isotype control is shown as colorless. The results are presented as median (range) of 3–5 independent experiments. (C) Immunofluorescence staining of OCT-4, vimentin and GFAP in cultured MenSCs and BMSCs. Scale bar: 100 µm.

