
Figure 6. System response timings.
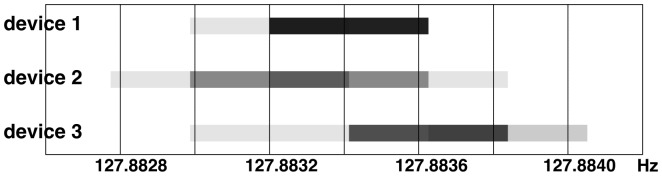
The system responds to the sinusoid signal peak (time 0). The red color ( ) indicates minimal observed delay; the blue color (
 ) indicates jitter. Galaxy Note running Android 4.0.1, 60 Hz AMOLED screen,
  ,
,  ; Nexus 7 running Android 4.1.1, 60 Hz IPS LCD screen,
  ,
,  ; MacbookPro, LCD screen (60 Hz),
  ,
,  .
.