
Figure 8. Distances between 4-sample frames.
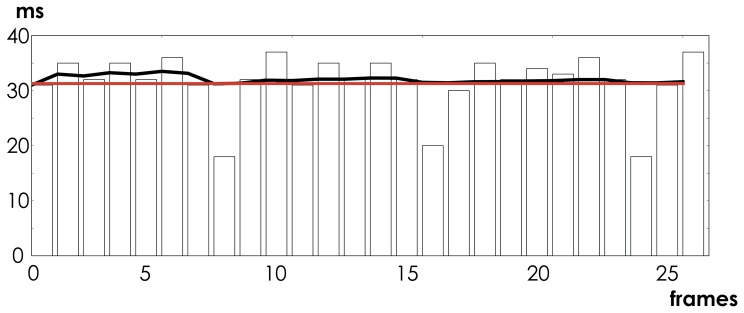
Red line indicates expected distance of  between the groups of four
  packets. The bars indicate the observed distance. We can see that the Emotiv system compensates every
  samples to keep the average (black line) at the correct level.