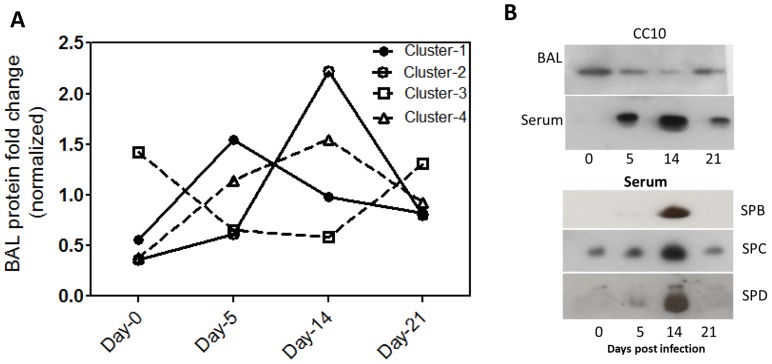
Figure 2. Dynamics of BAL proteome at different stages of influenza infection.
A. K-means cluster analysis of proteins that exhibited significant fold change across Days 5, 14 and 21 when compared with Day-0 of influenza infection. The Y-axis indicates a weighted value that is the individual value divided by mean across the four time stages. B. Immunoblot analysis of mouse BAL and serum to evaluate levels of selected lung proteins that were depleted from BAL during peak viraemia and inflammation.

