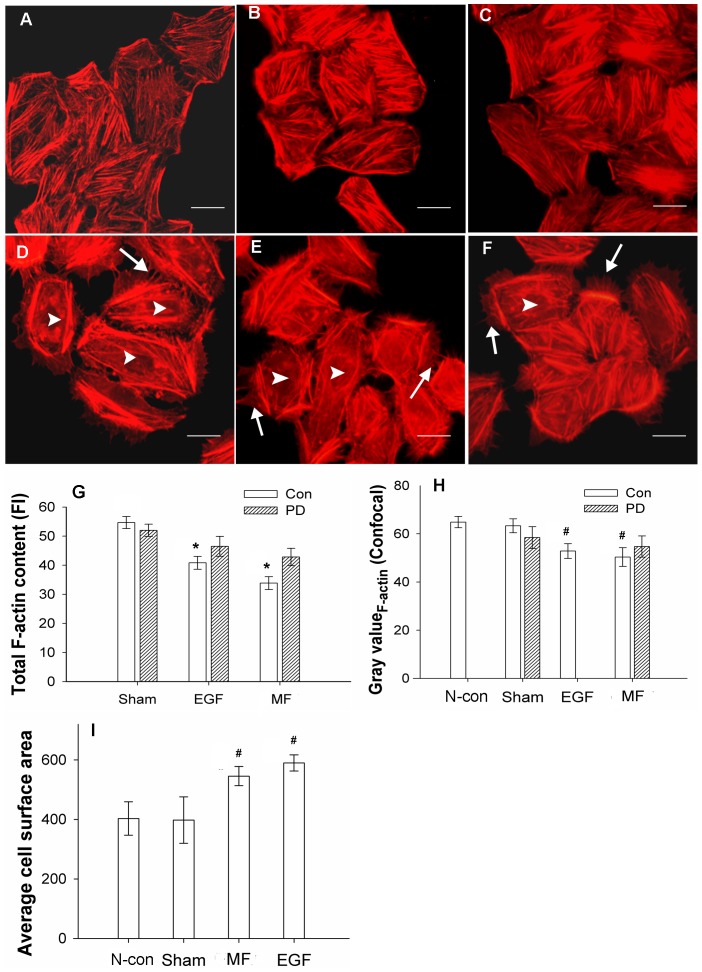
Figure 2. MF induced stress fibers and F-actin content decreases and cell surface increases in FL cells.
A: negative control (N-con); B: sham-exposed; C: pre-treated with 1 µM PD (+PD); D: pre-treated with 100 nM EGF (EGF); E: exposed to 0.4 mT power frequency MF (MF); F: pre-treated with 1 µM PD, then exposed to MF (+PD+MF). Microfilaments above were labeled with phalloidin-TRITC and photographed with an Olympus BX51 immuno-fluorescence microscope (×400). G: Decreases in total F-actin content in EGF- and MF-treated cells, measured by flow cytometry, P<0.05 (*). H: Gray value summary of F-actin content of FL cells from confocal images by ImageJ analysis, compared with N-con and Sham, P<0.01 (#). I: Average cell surface area increased, results were analyzed by ImageJ; compared with N-con and Sham, P<0.01 (#). Arrow: newly grown filopodia, arrowhead: loss of stress fibers in central area of the cell. Bar in A–F: 10 µm. The lines on each bar in G–I stand for standard deviation (SD), and the detailed information of experimental conditions and repeating numbers of samples is seen in Table 1.

