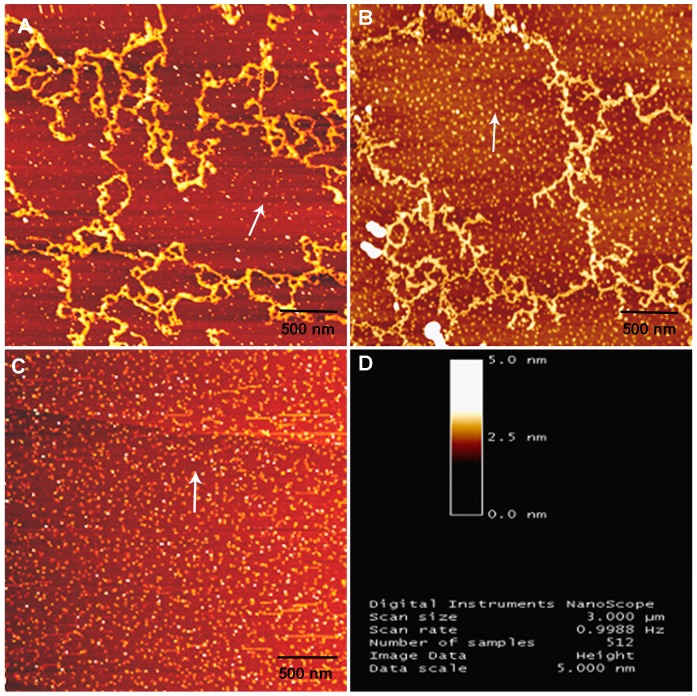
Figure 5. Decrease in the efficiency of F-actin assembly by power frequency MF.
A: sham-exposed G-actin to power frequency MF observed by AFM. B: exposed G-actin of self-assembled microfilaments to power frequency MF observed by AFM. C: free G-actin, without self-assembly, in sham exposure observed by AFM. D: AFM image index information. Arrow: free G-actin. Bar scale at the bottom of the image: 500 nm. The detailed information of experimental conditions and repeating numbers of samples is seen in Table 1.

